
Lok.exe RAT Malware
Lok.exe Malware
Opening the sample in Detect It Easy we can see some key information. The sample is written in C++, specifically utilising Borland. If you aren’t aware what Borland is-it’s an older IDE (Integrated Develop Environment) and compiler, a sucecssor to Turbo, for Windows. In addition to the usage of Borland, we can also see that this sample was created using Inno Setup. Inno Setup is a tool to create an installer package. Think of any software you’ve ever installed. Some software will require you to accept terms of agreement, you’ll hit next a bunch of times, until finally you can click Install. Well Inno Setup provides that feature set, where you can specify what gets installed. See more about it here, https://jrsoftware.org/isinfo.php
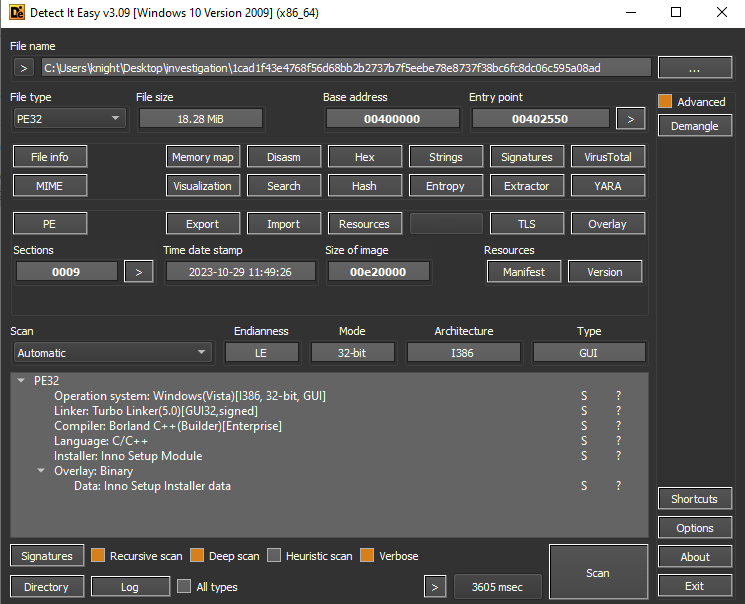
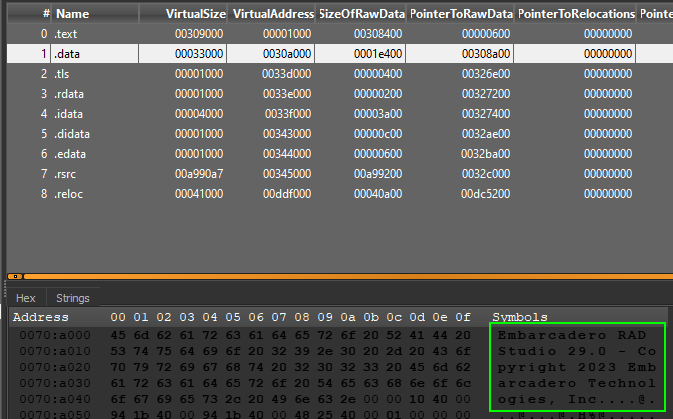
Opening the sections of the PE in Detect It Easy, if we navigate to the .data section we will see in the first few bytes Embarcadero. Since having never heard of this, I switched over to google to do some investigating. It appears that the RAD software is an IDE for C++ for building native apps. This gives us a bit more information on how this malware was possibly built.
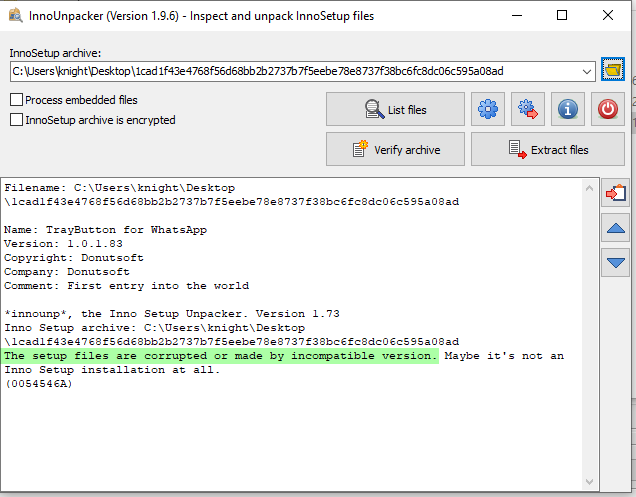
Since we’ve seen relations to Inno Setup piece, we can use InnoUnpacker as a means to determine if it’s possible to extract it’s inner data. However, it appears that the Inno Setup is corrupt, or maybe even encrypted.
Get InnoUnpacker GUI or CLI tools here, https://www.rathlev-home.de/index-e.html?tools/prog-e.html#unpack
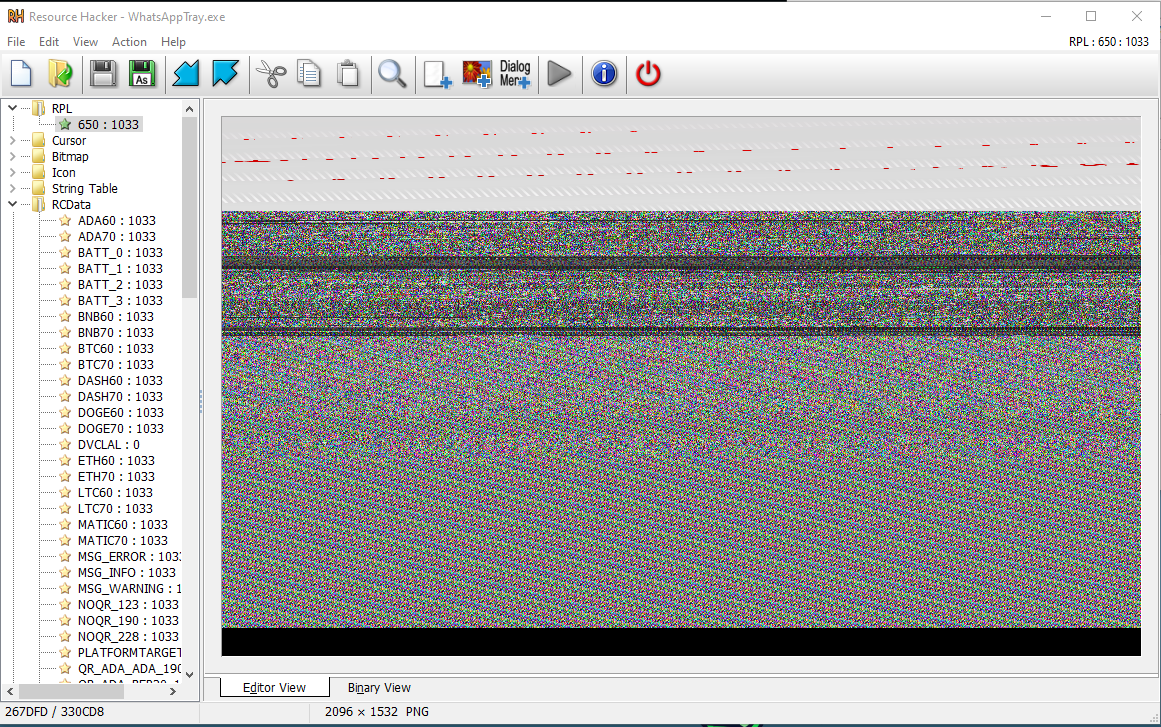
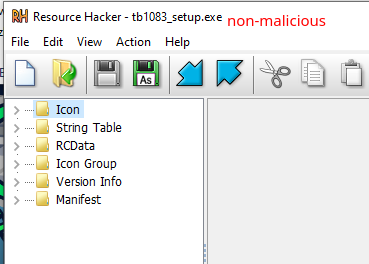
With no much to go off of, let’s open Resource Hacker to see what we can find.
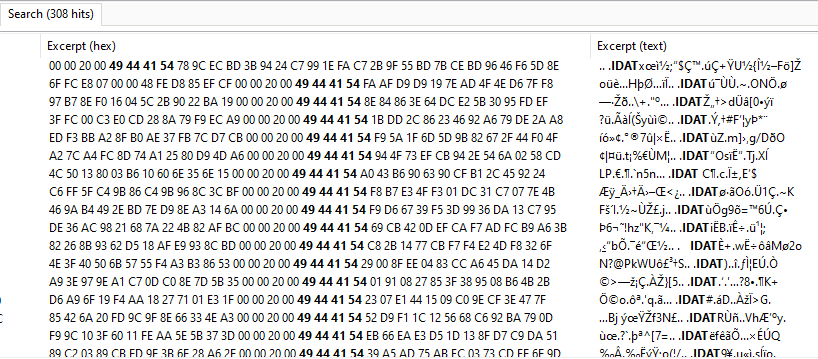
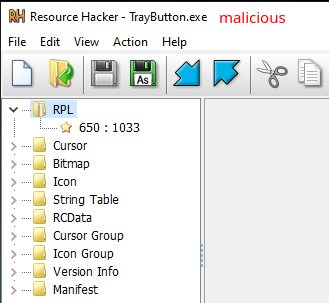
On initial inspection of the resources, a rather odd looking PNG is present in the RPL directory. At the moment I am not sure what to make of this. It’s possible this may be some encrypted data represented with PNG magic bytes in a file? Based on the article I’ve found here, https://www.bleepingcomputer.com/news/security/new-idat-loader-version-uses-steganography-to-push-remcos-rat/, and the several references to IDAT magic bytes, I may be on to something with my suspicions and warrants further investigation.
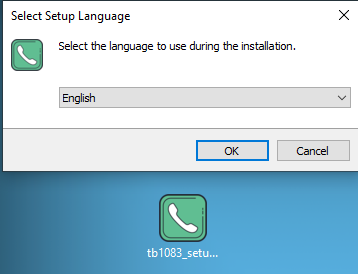
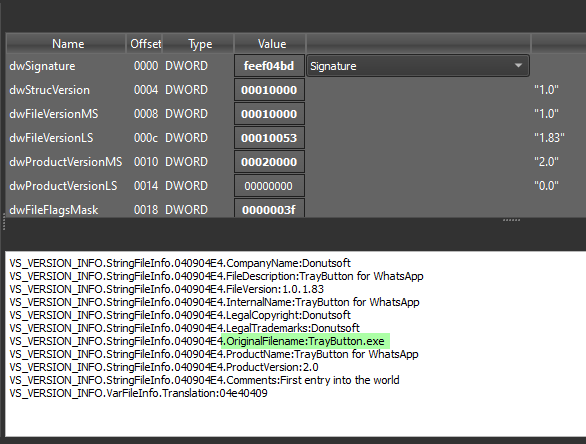
In addition to all the above, since we have information around the original file name, it’s version, and company, we can search the web for relevant information. This will help give us an idea between expected and unexpected behaviours. As a result I came across the following URL, https://donutsoft.org/. After downloading the portable and installers from this site into my analysis VM, I saw some differences.
We can see that the installer actually executes some sort of Inno Setup, compared to our malware, which just executes as we will see within the Dynamic Analysis section.
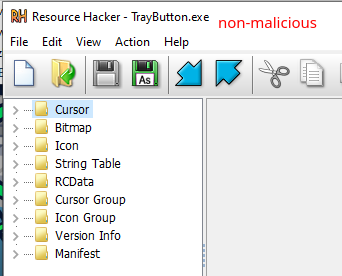
If we take a look at the portable version, we can find all related resources and libraries accompanied with it.
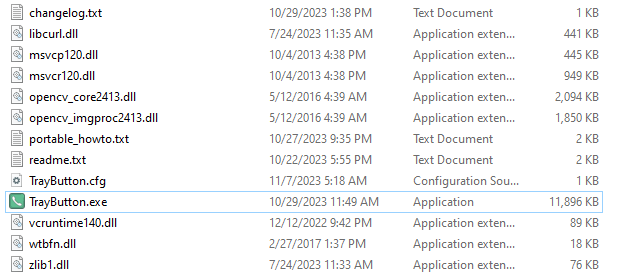
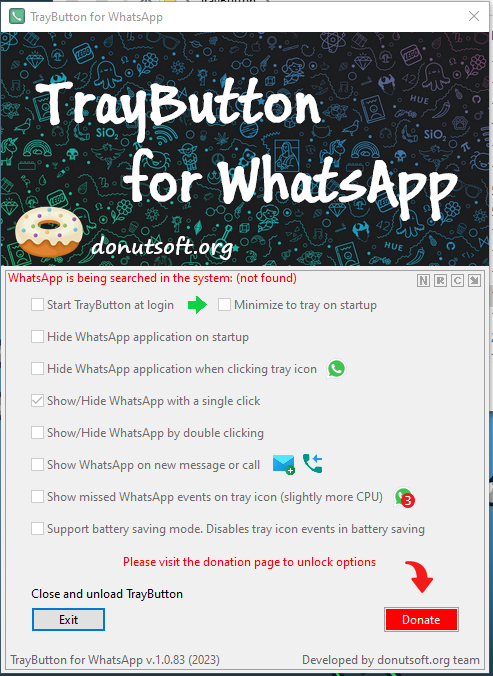
And based on this portable version we get the similar and expected results as we can see based on their web page.
What was interesting between the actual installer and portable version in comparison to the malicious file is that there is not instance of RPL resource.
Setup version
Portable version
Malicious file
Dynamic Analysis
Before jumping into looking at the code and how it’s structured, I am going to take the approach of running some dynamic analysis. In doing so, this may or may not give us some idea of how the malware executes, what it creates, and so on. I find this step helpful, especially when it comes to malware written in C++ leveraging windows API libraries.
Remember, when doing Dynamic Analysis it’s important that connections outbound are severed. Since we don’t understand how this malware behaves, it’s ideal to not let it communicate out. In addition, make sure that snapshots are being leveraged to revert back to previous states. Once we execute the malware, we don’t want to have to rebuild our analysis VM over and over again.
Reviewing the sample again, we will want to make sure this file is named appropriately with what the original file name was. This ensures that any anti-analysis techniques based on the file name itself will not prevent it from executing. As we can see TrayButton.exe is the original file name.
Before executing the malware, a few tools need to be setup prior to.
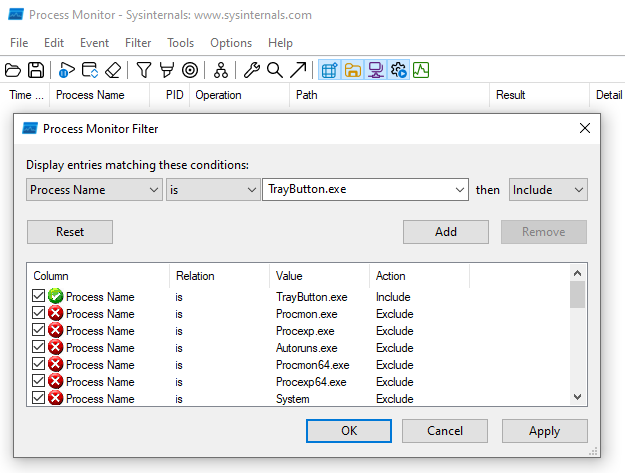
Process Monitor with Filter
Process monitor will need to be configured with the appropriate filter and started prior to the execution of the sample.
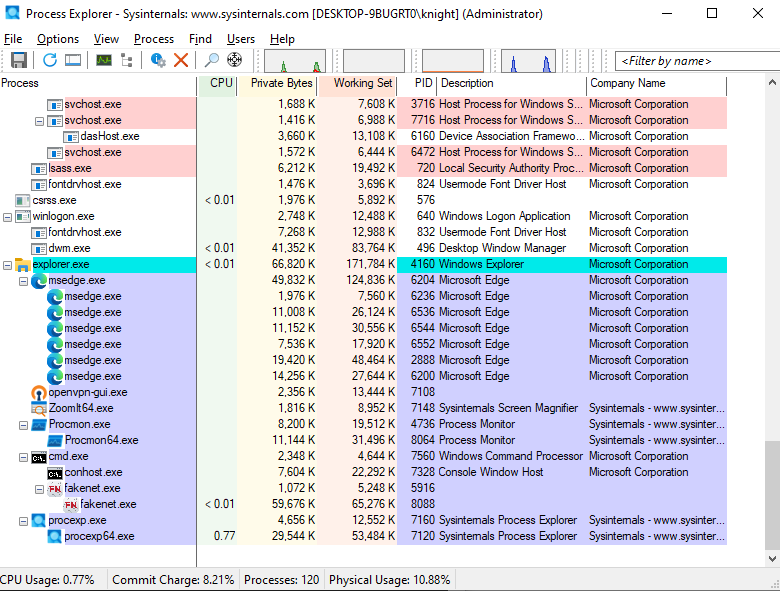
Process Explorer
Helpful in identifying new processes opening and investigating their threads, creating dumps, reviewing TCP etc.
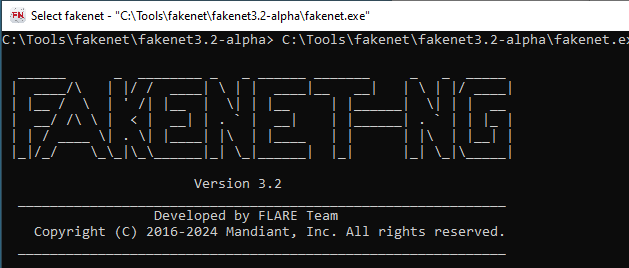
FakeNet-NG
FakeNet will be utilised in order to intercept any potential calls made out by the malware to C2 servers as well as assist in identifying any payload that may be useful to our RE.
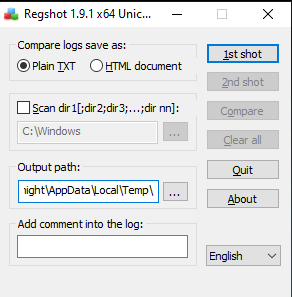
Regshot
Regshot will need to take it’s first shot of the registry prior to execution of the sample. Ideally to prevent additional noise you will want to make sure that all your analysis tools are open prior to taking the first shot. Note: Regshot can take some time to process, just be patient.
Reviewing Tool Results
With all of our tools setup, we can now being executing our sample and reviewing the results.
Review Process Explorer first, since if we are not quick enough we will see some of the processes terminate themselves, we can see TrayButton.exe being executed following the creation of more.com and conhost.exe.


While letting the malware run for a short while, we can take our second RegShot. Once the second Regshot is complete, we can run a compare to identify any changes made by the malware.
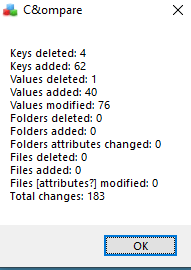
Taking a look at the RegShot compare values under keys added. We can see some strange behaviour. It appears the malware creates a new schedule task.
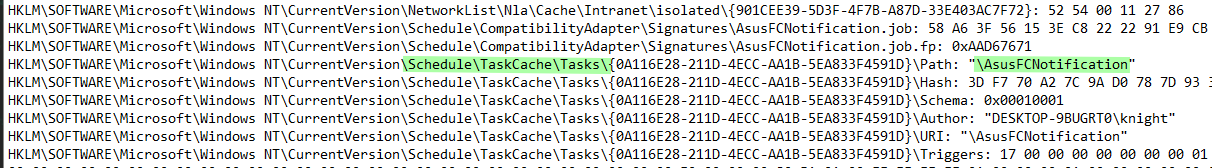
We can confirm this by opening the windows Task Scheduler. After reviewing the task scheduler we can see the newly created AsusFCNotification task.
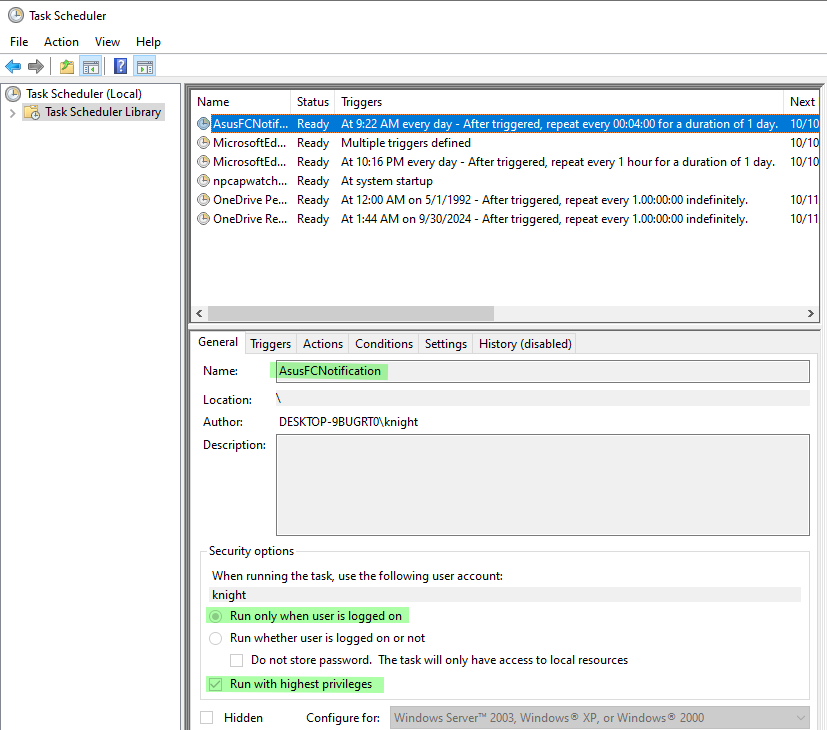
Reviewing the Actions section of this scheduled task, we can see a path to an executable that the malware may be using in order to create persistence.
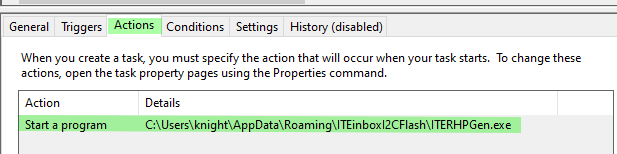
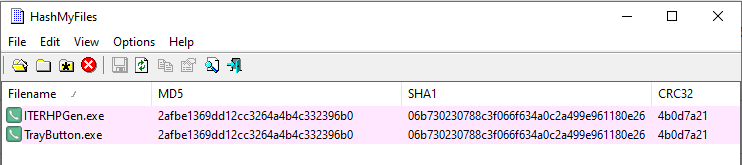
After reviewing the directory where this program is being stored, we can certainly see that it contains the same icon as well as matching hashes. Which would certainly confirm our suspicion surrounding creating persistence.
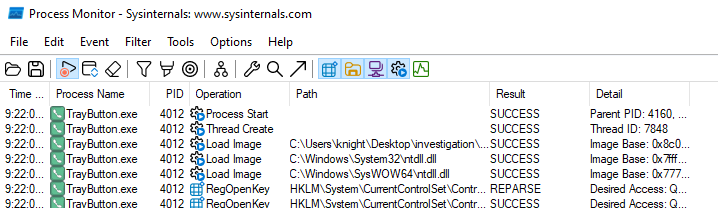
From Process Monitor we can see the newly created PID 4012. We will use this PID later as a parent PID to identify additional behaviours.
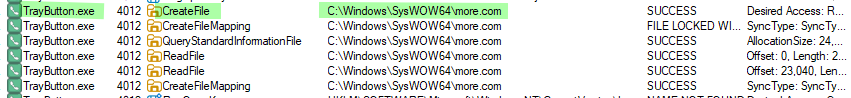
Reviewing more of the results within Process Monitor we can also see the following,
Creation of the more.com file in the C:\Windows\SysWOW64\ directory
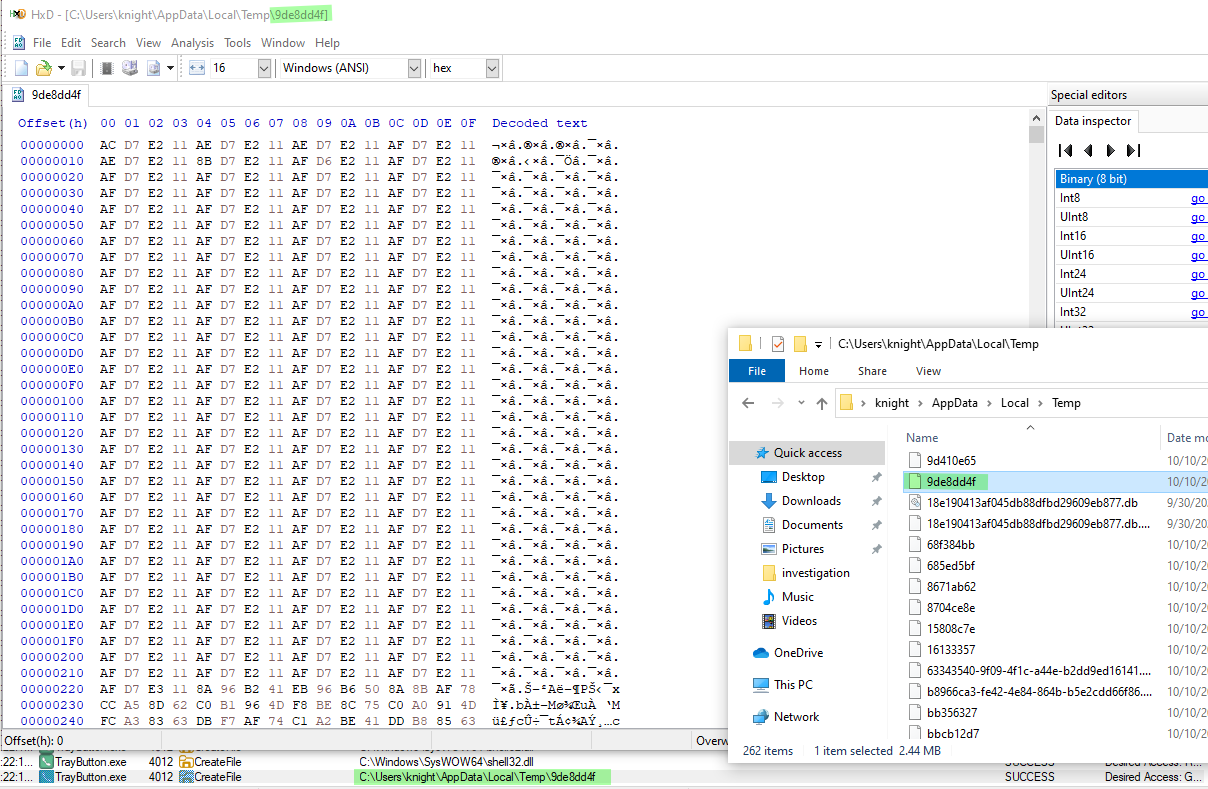
Create of a temporary file 9de8dd4f containing byte data
Before pivoting to filtering on the parent PID value 4012, we can export all the data within Process Monitor as a csv file. Since we are dealing with so many events we can switch to procdot, to make things a little easier. ProcDot is a tool to get a visual representation of the monitoring that has taken place within Process Monitor.
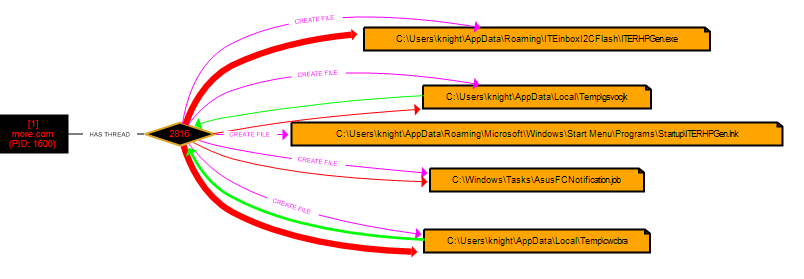
Taking a look at ProcDot we can select the PID associated with more.com and review it’s processes. With this we can now see the previously mentioned task creation for the window task scheduler in order to create persistence.
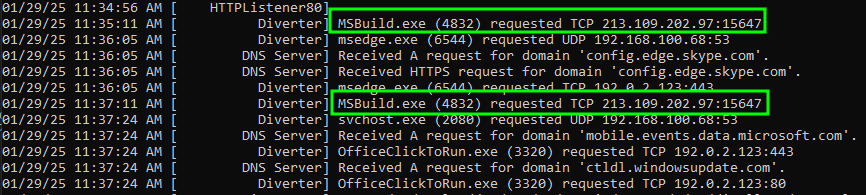
Finally, looking at our FakeNet logs, we can see that a call was made out on behalf of MSBuild.exe to the IP and port 213.109.202[.]97:15647 via a raw TCP socket. We can also see that along with this call a json payload was sent within the frame, containing a Type of AfkSystem.

Debugging & Reversing
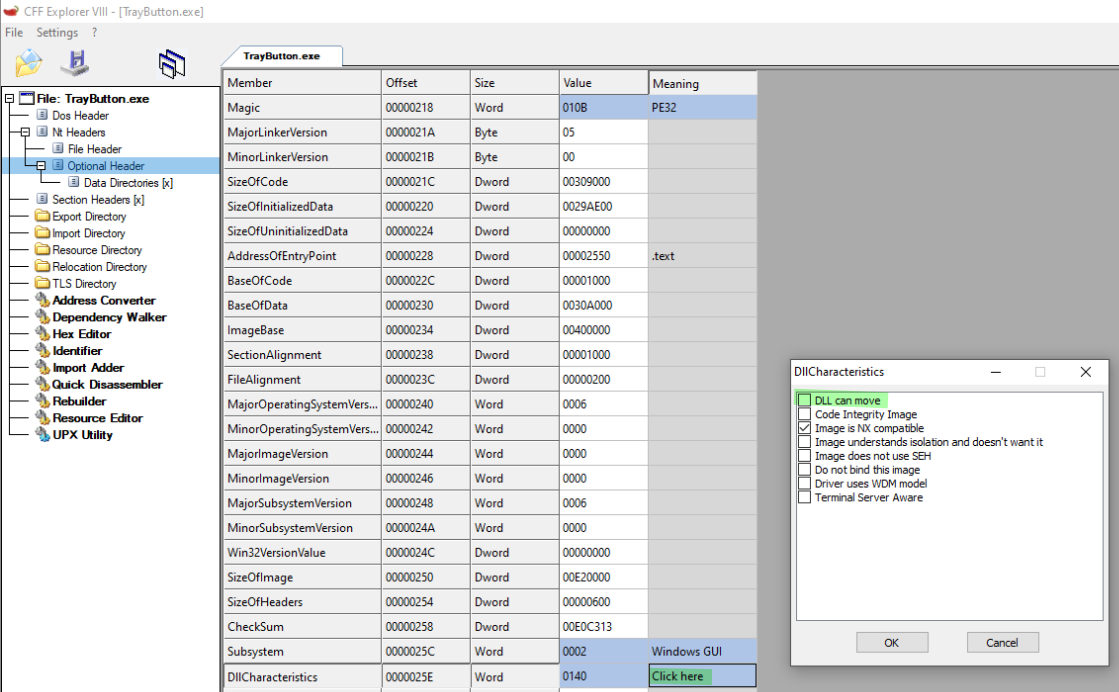
For this next step we will configure some DLLCharacteristics using CFF Explorer. We will need to modify these characteristics to ensure that the DLL does not move. In doing so we will be able to follow along within Ghidra at the same base memory address. This will make it easier as we walk through the code to identify where exactly we are within the debugger in comparison to the decompilation. Once these changes have been made we can save our new version to the desktop and open within x32dbg and `Ghidra.
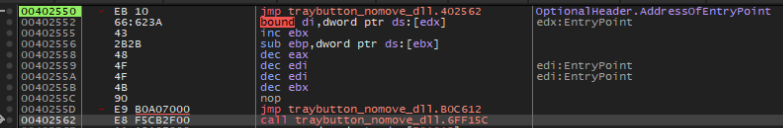
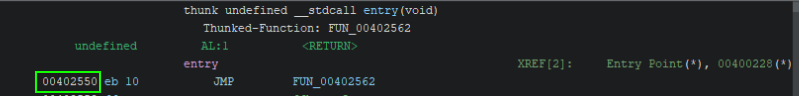
As indicated from our previous step. If we take a look at the entry point within both x32dbg and Ghidra we can see that they align.
Following the code paths we will eventually stumble upon enumeration of the CPU information. As we can see based on the value of EAX being 0 we result in the values as defined here, https://www.felixcloutier.com/x86/cpuid#input-eax-=-0—returns-cpuid%E2%80%99s-highest-value-for-basic-processor-information-and-the-vendor-identification-string
Meaning the sample has successfully identified we are on an intel processor.
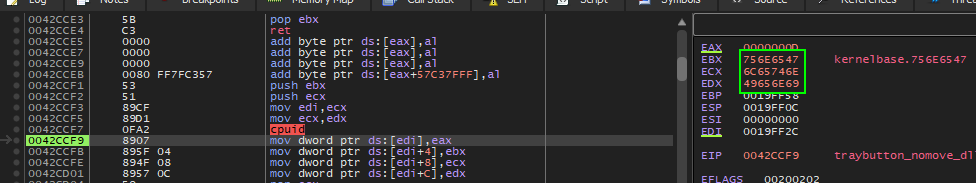
If we were to look in Ghidra at this specific moment in time, we would see that the debugger correlates.
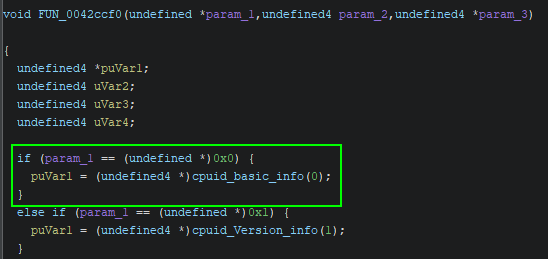
Investigating the previous references to the FUN_0042ccf0 call, we can find ourselves within a do while loop. This loop will result in the evaluation of cpuid from 0x0 to 0x7, providing an much larger enumeration of the CPU info.
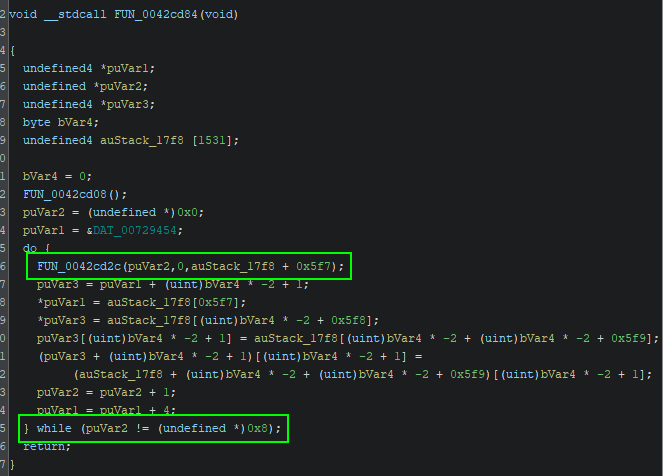
The below table will explain the various values associated with the EAX register parameters.
Additional processor enumeration.

Whether this information is being leveraged within the execution of the malware has yet to be determined, but regardless, some great knowledge and understanding on concepts.
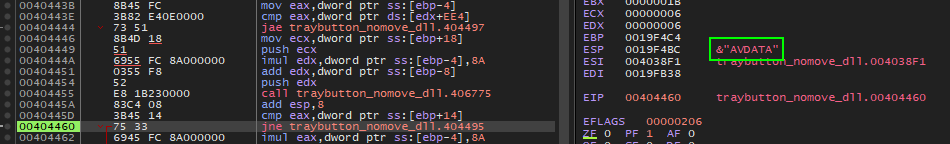
After debugging for several hours I felt defeated, but I was certainly not giving up. Continuing on I began to slow my process and came across some odd behaviour. I came across several strings regarding AVDATA, ESAL, ESAL64, ESLDR, ESLDR64, ESWR, and FIXED etc. Doing some research online for what these values represent, I came across the following articles.
https://www.zscaler.com/blogs/security-research/technical-analysis-hijackloader
https://www.zscaler.com/blogs/security-research/hijackloader-updates
These two articles correlate very nicely with previous assumptions of the data stored within RPL resource directory.
AVDATA module
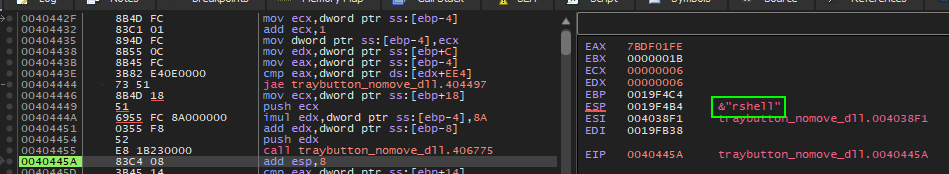
rshell module
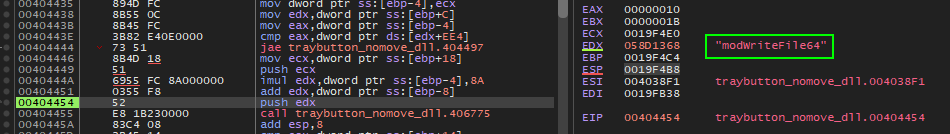
modWriteFile64 module
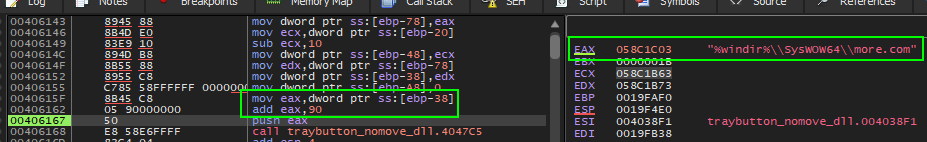
The process to be injected to
Now knowing that this is possibly a version of Hijackloader we can certainly keep it in mind while debugging. After restarting the sample multiple times and going through debugging, I stumbled upon a particular function in which is leveraging GdiBitmapGetPixel. The purpose of this function is to obtain the colour of a pixel within a bitmap.
![]()
Looking at Microsoft documentation, we can certainly tell that in order for this to be effective, a picture file must be loaded into a bitmap from a resource based on the following example,
https://learn.microsoft.com/en-us/windows/win32/api/gdiplusheaders/nf-gdiplusheaders-bitmap-getpixel
VOID Example_GetPixel(HDC hdc)

{

   Graphics graphics(hdc);

   // Create a Bitmap object from a JPEG file.
   Bitmap myBitmap(L"Climber.jpg");

   // Get the value of a pixel from myBitmap.
   Color pixelColor;
   myBitmap.GetPixel(25, 25, &pixelColor);

   // Fill a rectangle with the pixel color.
   SolidBrush brush(pixelColor);
   graphics.FillRectangle(&brush, Rect(0, 0, 100, 100));
}
After reviewing the stack we can see that the sample did in fact reach out to a resource in order to load it.
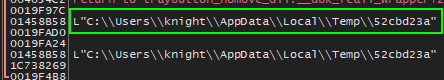
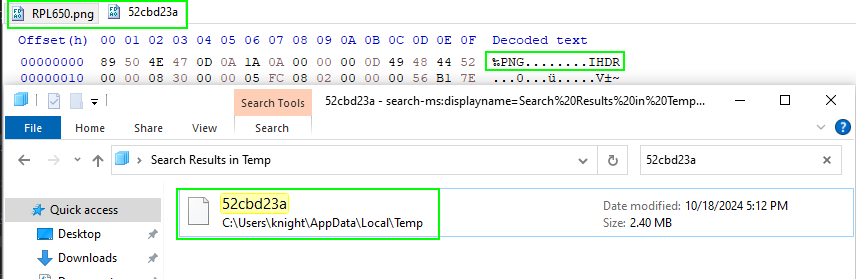
Before moving on, taking an initial look at this file, we can see it is of a PNG format. Matching that of the RPL resource previously identified. And based on our dynamic analysis, we know that the sample creates a new temporary file within the %APPDATA% space.
Taking a look back the debugger and investigating the stack a bit more, we can see how the parameters for GetPixel are prepared.
![]()
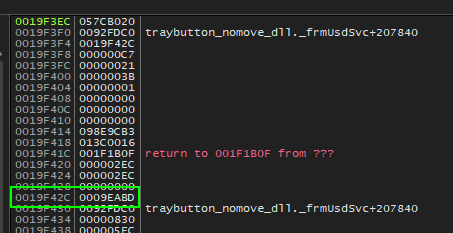
Once stepped over the GetPixel function, our result will be stored within 019F440.
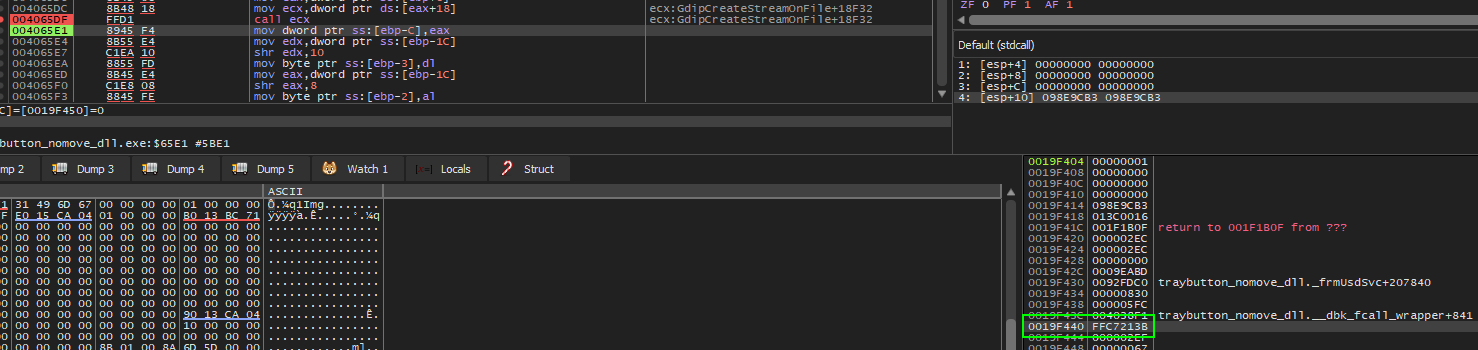
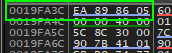
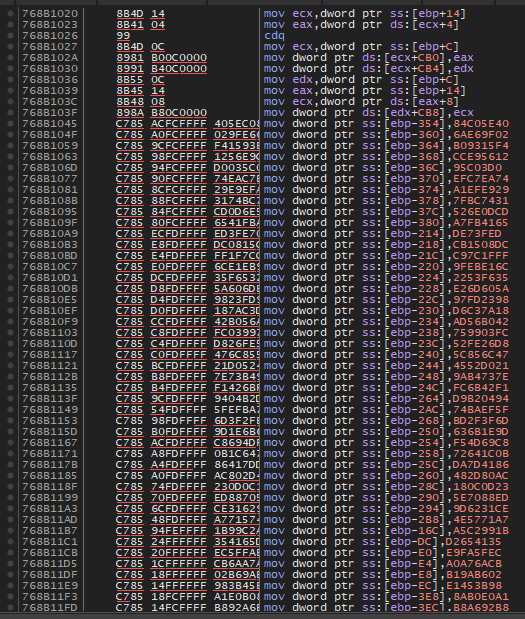
This value is then manipulated in many ways until the RGB values of the returned Color as defined below are moved into their respective positions of ebp-X where X is a value between 1 and 3.
void Color(
  [in] BYTE r,
  [in] BYTE g,
  [in] BYTE b
);
With these values now stored in EBP they are pushed onto the stack in opposite order before calling the next function. In addition to these values the following are being added before the function call.
[EBP-30] Containing the write offset of where to write within memory, which we will see later.
[EBP-2C]
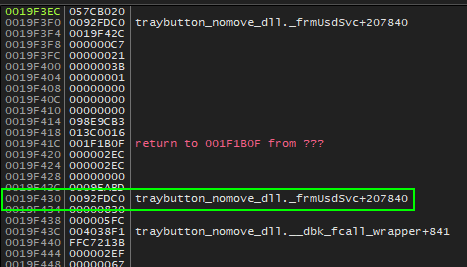
[EBP-2C] The base write offset in memory where the resource is being written to.
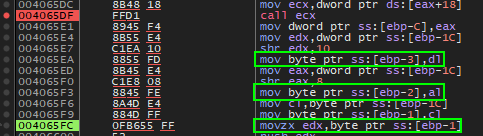
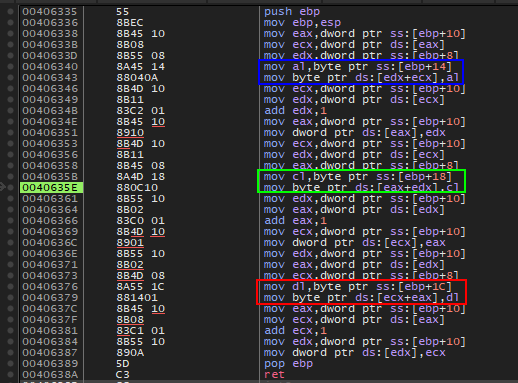
Now that the parameters are pushed onto the stack, the function can be called. Stepping into this function we can see there is nothing overly complex about it. There just happens to be a lot of moving of data.
Firstly the offset is moved into ECX which will be used later in combination with the base offset to determine where to write the data.
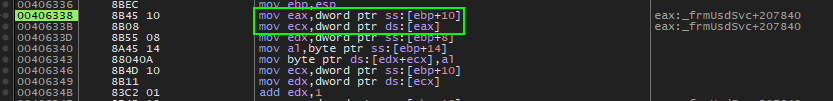
EDX will then be populated with the base offset of the desired write location.
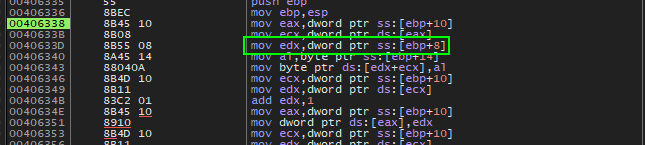
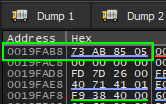
Following this the previous value pushed onto the stack containing the B value from RGB is moved into al. Once in al it is then written into EDX+ECX (base offset + write offset).
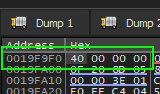
Before
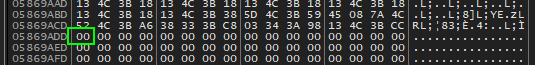
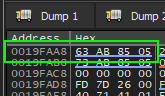
After
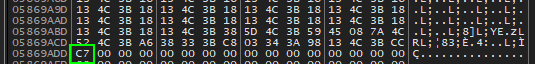
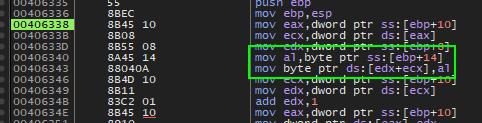
Once written, the address in which stores the write offset is moved into ECX followed by it’s value moved into EDX which is then incremented by 1 for the next write operation.
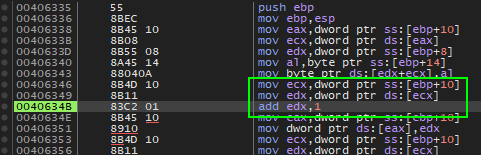
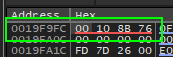
Going forward similar operations are being performed in order to load the remaining RG values from RGB.
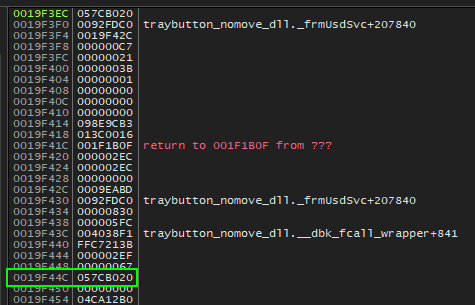
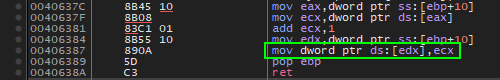
Once all values have been stored the new write offset is placed within ds:[EDX] for the next iteration of values.
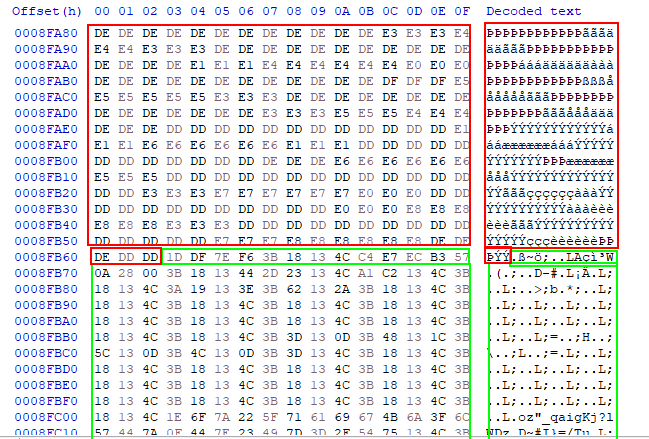
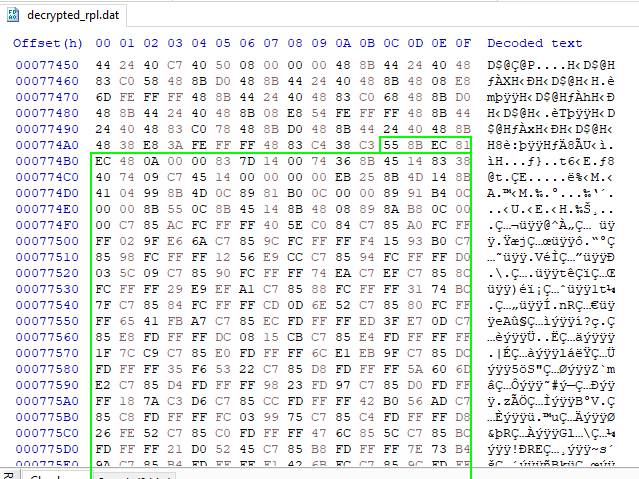
Following the debug process I stumbled upon the xor decryption function.
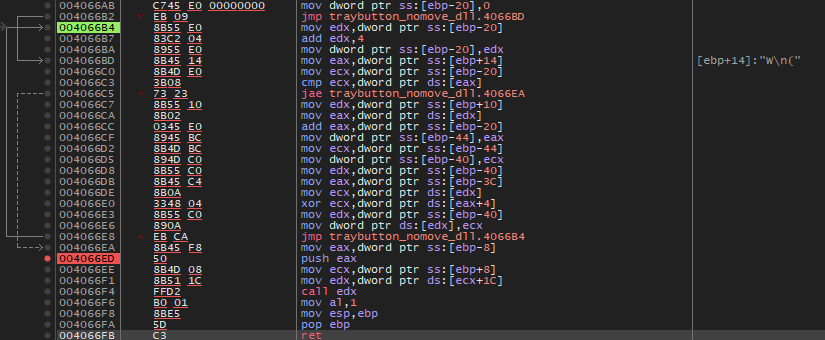
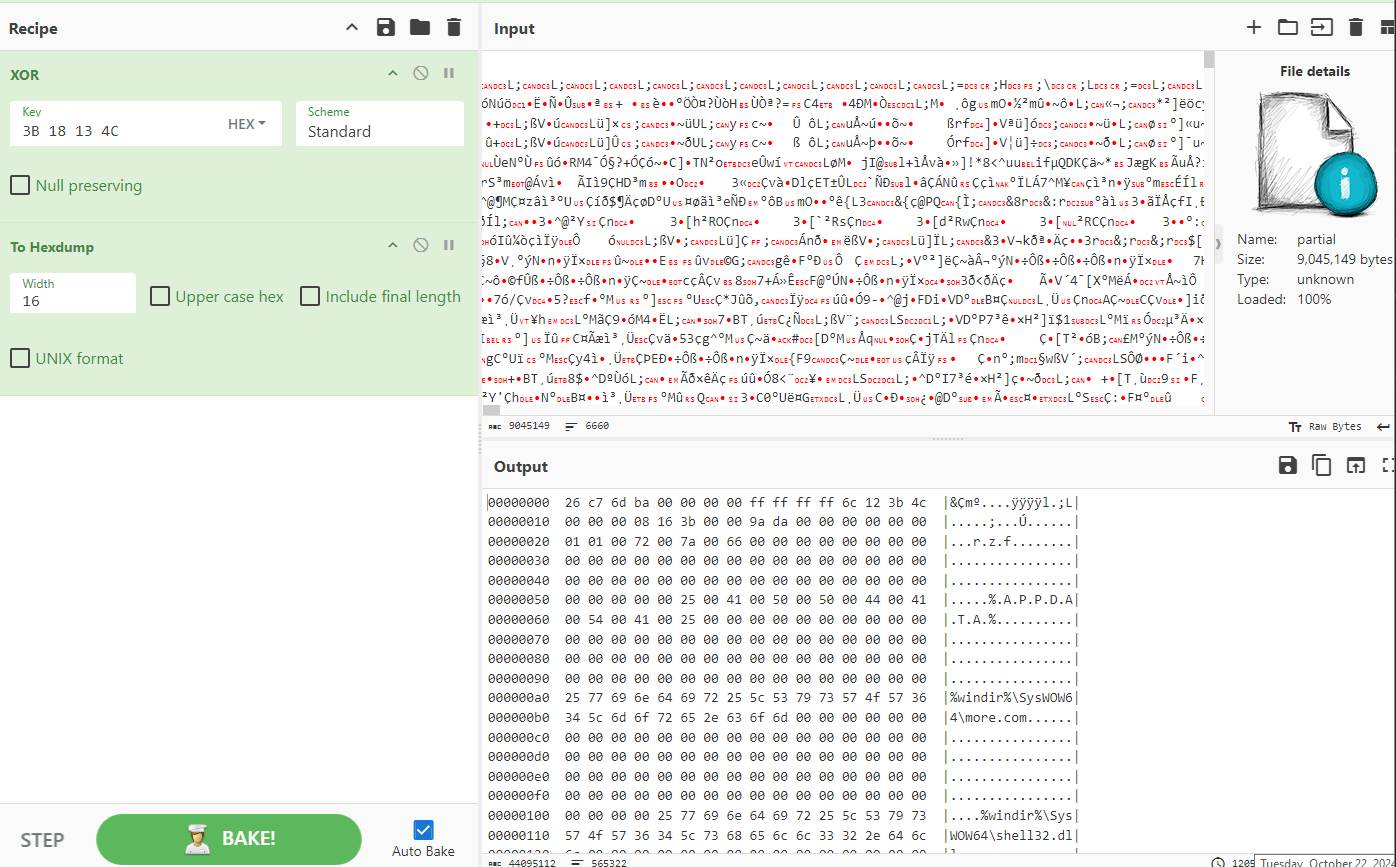
After close inspection I noticed that - one - the value being used to XOR is never changed. This value seems to be 3B 18 13 4C stored within [EAX+4].We can prove this by doing the following within CyberChef. And - two - The data being used to XOR against starts after a large amount of garbage values.
As we can see confirming within CyberChef we are able to successfully execute the XOR against the resource and result in some clear text information that aligns with what we have been seeing in our dynamic analysis.
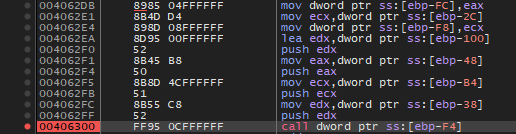
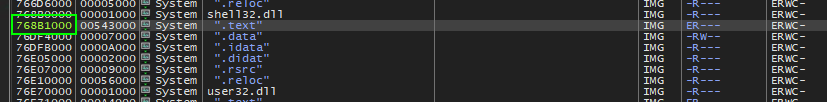
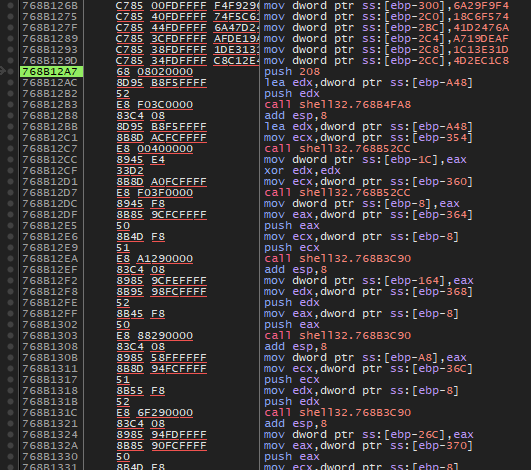
Debugging further, we begin to see things like shell32.dll being loaded into memory and ensuring that it’s VirtualProtect is set with 0x40 which is a known value for PAGE_EXECUTE_READWRITE. With shell32.dll now loaded into memory we see that later on in the execution of the sample, a direct call within the library is being called passing in the following.
[EBP-100] the value 0x40
[EBP-48] the start offset to which the resource was loaded, in this case 0585AB63
[EBP-B4] the end offset to which the resource was loaded, in this case 058689EA
[EBP-38] the start offset 10 bytes in to which the resource was loaded, in this case 0585AB73
Once the values are pushed onto the stack a call is being made against [EBP-F4], resulting in a direct call within the shell32.dll.

Stepping into this call function places us within shell32. As we step through we can see modification to the resource offset mentioned where we can see updates happening to include additional addresses being set to point to shell32.
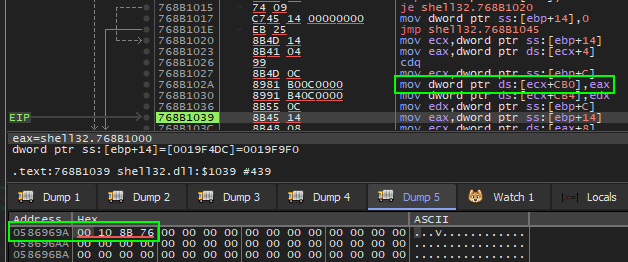
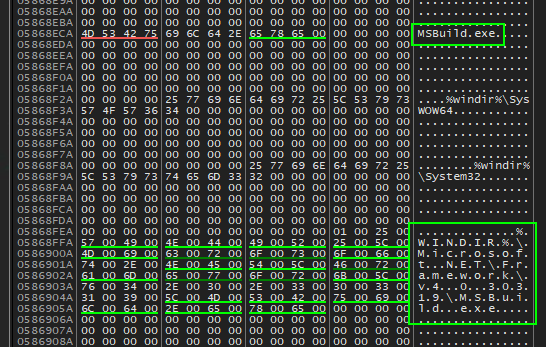
And when looking with this address space, scrolling up we can see based on dynamic analysis strings for MSBuild.exe. Perhaps this is building up to the point where injection or execution occurs within MSBuild.exe to execute malicious behaviour.
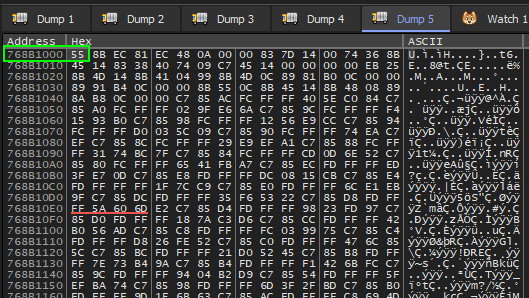
Taking a further look into the shell32, it possessed me to investigate whether or not this is the real shell32 loading from the SysWOW64 directory. After dumping the memory - to my surprise, was not in fact the same. Of course I am only human and must have missed where in the sample that this was performed.
Comparing hashes, sizes, etc lead to a significant mismatch.
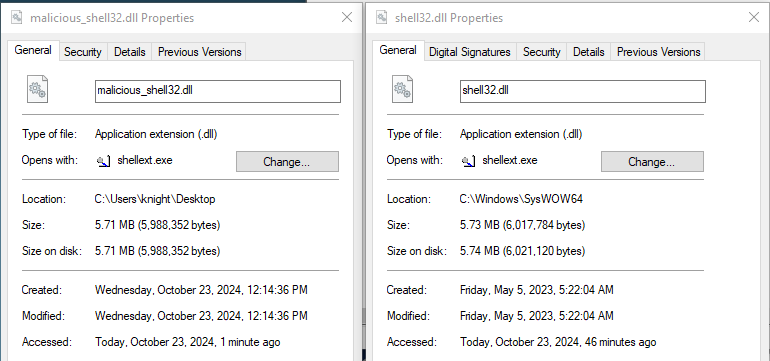

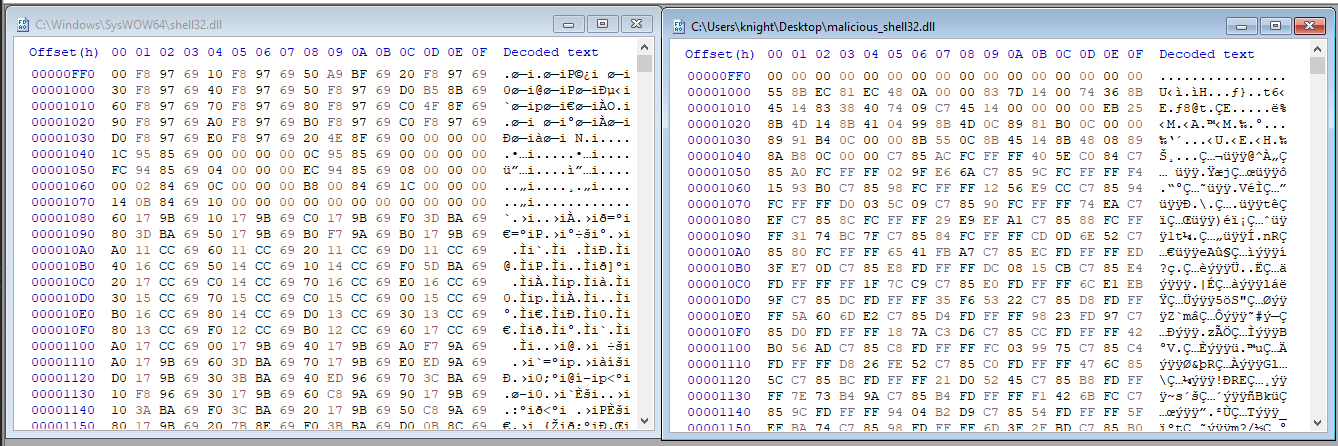
After further investigation, I took the supposed base address of the .text section within shell32 and copied the first 32 bytes. Comparing it against the decrypted RPL resource, we can see these bytes line up. So obviously the original memory within the shell32 loaded into memory was overwritten.
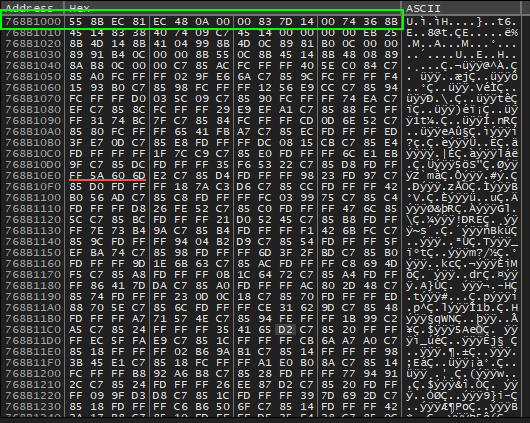
Now looking back at our assembly in x32dbg it is obvious that any calls made out the shell32 may be invoking malicious code.
In addition as we step through we will see a number of changes to the EBP memory space resulting in various new addresses and data changes.
This is then followed by several calls being made the “shell32” functions while accessing and pushing EBP values onto the stack before the calls.
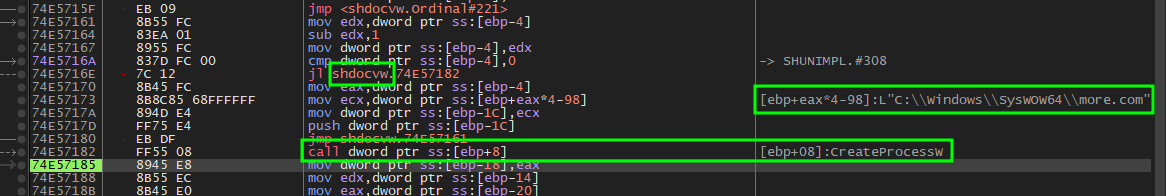
After reviewing the calls from shell32, we can place a breakpoint on CreateProcessW within x32dbg with bp CreateProcessW. This will help us identify the calling function for more.com. As we can see we find ourselves at the breakpoint and can analyze how the process is created and review the handles for future references.
CreateProcessW (
  0 // lpApplicationName,
  L"C:\\Windows\\SysWOW64\\more.com" // lpCommandLine,
  0 // lpProcessAttributes,
  0 // lpThreadAttributes,
  1 // bInheritHandles,
  0x080000000 // dwCreationFlags -> CREATE_NO_WINDOW
  0 // lpEnvironment,
  0 // lpCurrentDirectory,
  0x0019EF74 // lpStartupInfo,
  0x0019F3F0 // lpProcessInformation
)
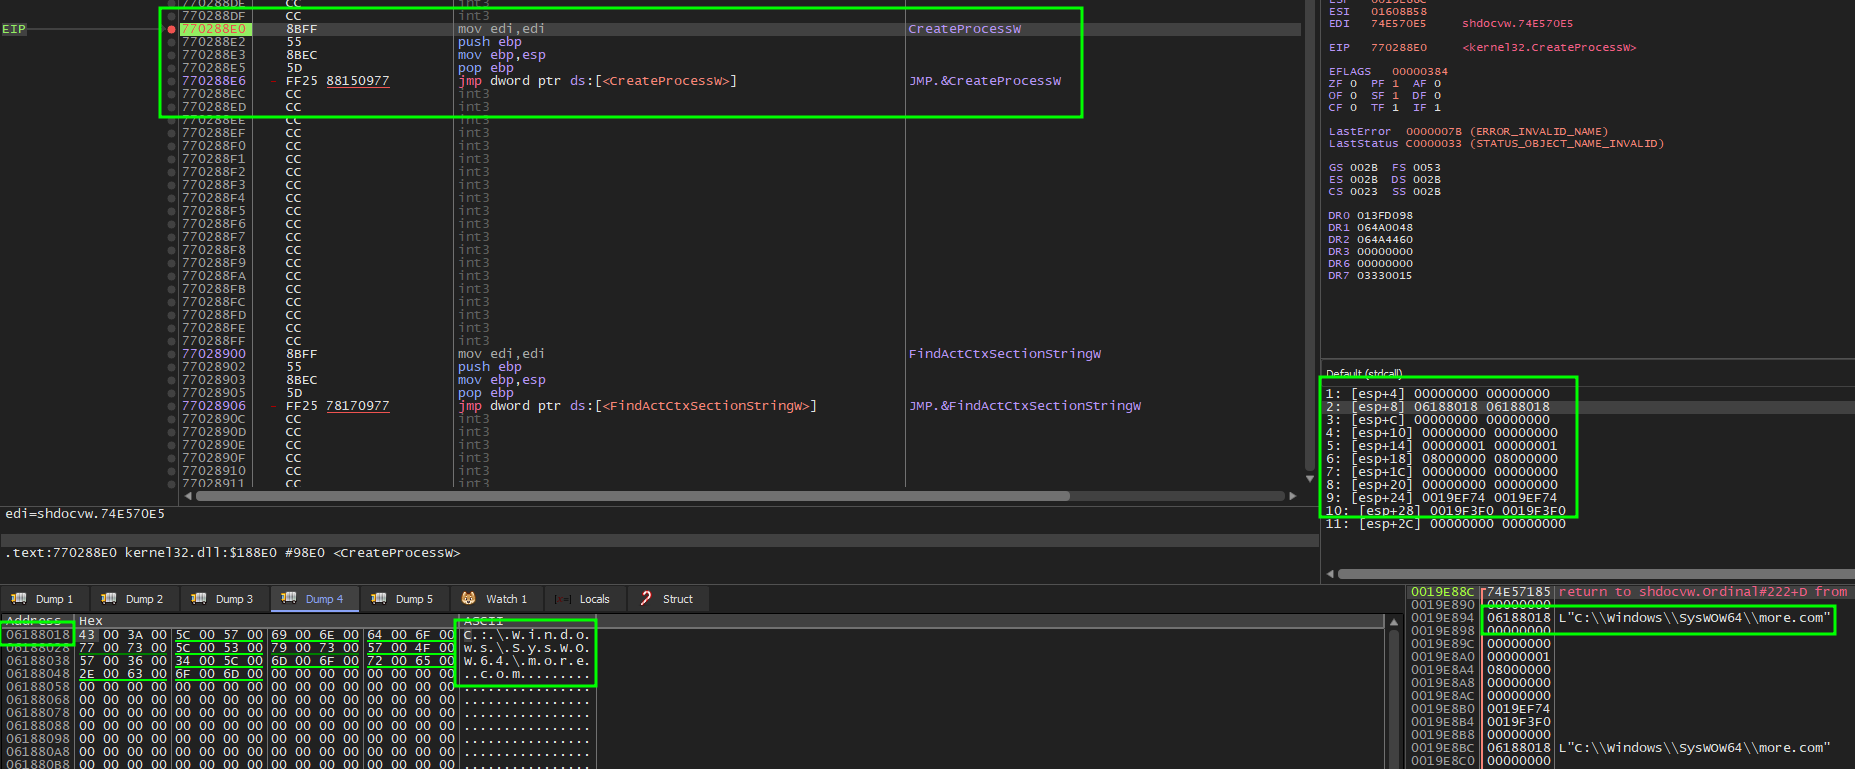
On return from this function we can see we land ourselves within shdocvw.dll. This library in particular is for use within Internet Explorer Integration, Windows Shell Integration, handling of web protocols, and provides legacy support for older applications. However, I believe this is being leveraged for DLL hallowing. A method to be more evasive by using file-less techniques in order to hide in plain sight within the memory of the sample.
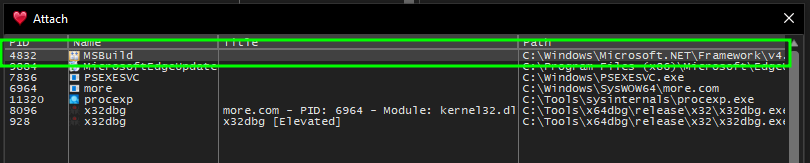
Since we now have quite a lot of details in terms of how more.com is being executed, let’s now try and take a look at debugging it. With our existing breakpoint to CreateProcessW, we can take one step over and begin attaching a debugger using x64dbg. It’s important to leverage x64dbg here because we know that more.com is coming from C:\Windows\SysWOW64\.

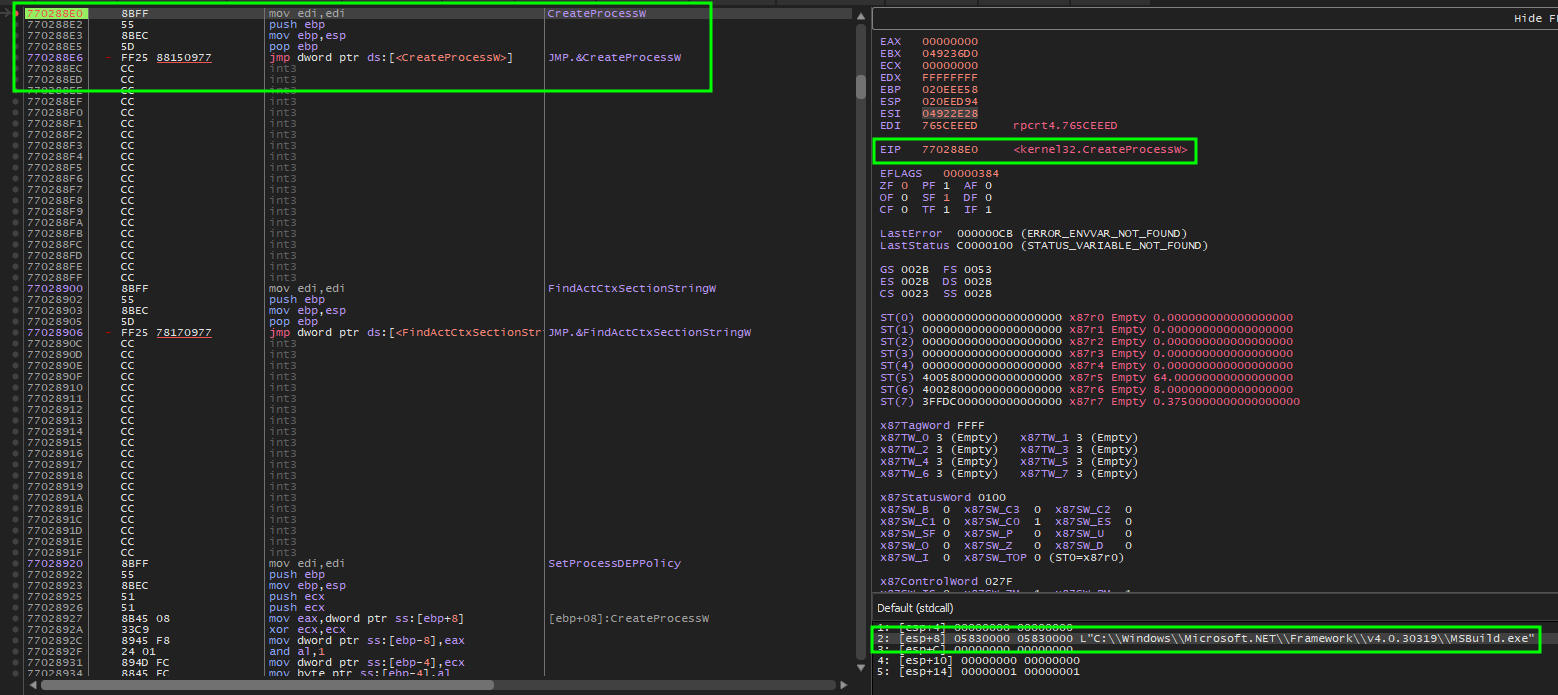
Before continuing the execution after our CreateProcessW within the TrayButton app, we will want to set a breakpoint on CreateProcessW for our newly attached debugger via bp CreateProcessW. This will give us the chance to capture MSBuild.exe as it attempts to spin up.
CreateProcessW (
  0 // lpApplicationName,
  L"C:\\Windows\\Microsoft.NET\\Framework\\v4.0.30319\\MSBuild.exe" // lpCommandLine,
  0 // lpProcessAttributes,
  0 // lpThreadAttributes,
  1 // bInheritHandles,
  0x000000004 // dwCreationFlags -> CREATE_SUSPENDED
  0 // lpEnvironment,
  0 // lpCurrentDirectory,
  0x020EF878 // lpStartupInfo,
  0x020EF8C4 // lpProcessInformation
)
Before returning from the CreateProcessW of the MSBuild.exe we can attach another debugger to ensure we capture it’s progress.
Once successfully attached we can revisit our other instance of x32dbg that is debugging more.com and continue it’s execution so that MSBuild.exe can takeover.
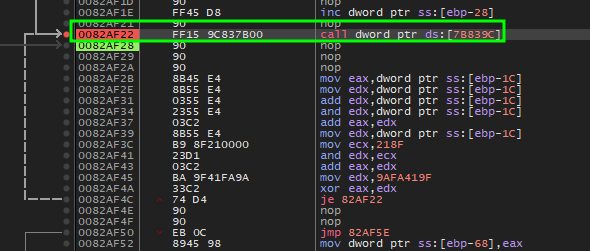
After spending a little of time debugging the process, I came across a location in which I could see calls out to the C2 were being made. In order to determine this we can review the functions and identify any communication out that is being made on behalf of the sample as we debug. In particular the function call at 0082AF22 makes a request out to the C2 as we can see within FakeNet.
While stepping through the function, we can see that the sample generates a json message within the ECX register.
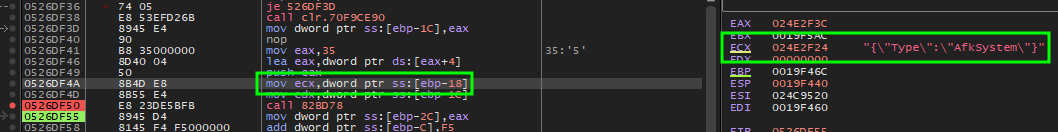
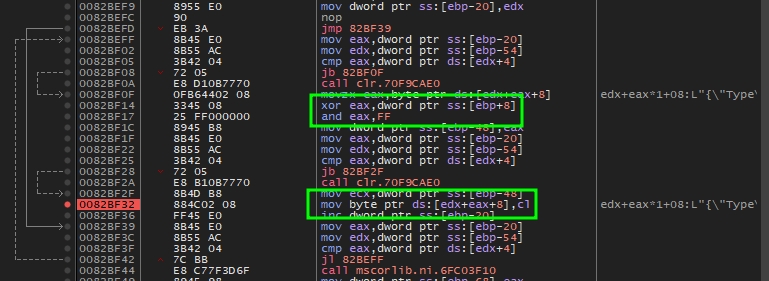
This is returned by the process of decryption via manipulation using xor and and which we can see at 00828F32. Once the values are fully xor we will find our resulting AfkSystem json value.
This value as we see is very common to SectopRAT also known as AerchClient2.
Indicators
| Type | Value |
|---|---|
| IP:PORT | 213.109.202[.]97:15647 |
| MD5 | 2afbe1369dd12cc3264a4b4c332396b0 |
| SHA1 | 06b730230788c3f066f634a0c2a499e961180e26 |
| SHA256 | 1cad1f43e4768f56d68bb2b2737b7f5eebe78e8737f38bc6fc8dc06c595a08ad |
| MD5 | d613d54f9e0270665a221b3f4405c447 |
| SHA1 | ec38708036819ef839107a7dbf3cc0d0592291d4 |
| SHA256 | 5fe78af08734f2c820c29e2f93e4b31a6796b83373f536cca0d851622ef52e0c |
| MD5 | 75b409ad12ff58926e3a1d3c5d345aba |
| SHA1 | b1a966d18dd4442febe90a7b268a18cae0fb4bfc |
| SHA256 | aaedbfa2f1d9fb65d3e2cecbf3f98fce17db988e13d2619c0f75c2fe948020ae |
| MD5 | f477a739e2d63d878730880c77f7145f |
| SHA1 | f7b7640b5bf5a0fd4968334522b0609fb7cc2cc5 |
| SHA256 | a6217d1567efffc623b6087a1dbfb771604a58f4d069777e57d086aae0378ad0 |